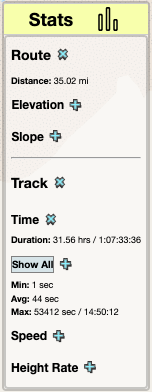
Properties compiled over the full Track are displayed through a control. Route stats are related purely to the static physical details of the track and can be displayed for newly drawn Routes. Track stats are time-dependent stats and are only displayed for recorded movements.

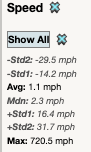
Below shows an example of the main speed stats for the track. Expanding ‘show all’ shows less common, more statistically-related stats that give further insight into the route/track, such as median and standard deviations, as well as criteria used by the app in cleaning the track.
 |  |
|---|
In v1, these same properties will be displayed for any custom sub-section of the Track, such as a selected range.
